Dying Early
Graphics, generative data art and development of an interactive about low U.S. life expectancy.
✨ See the story on washingtonpost.com →
🏆: Winner, Investigative Data Journalism (Large Newsroom), Online Journalism Awards; Award of Excellence, Infographics: Health, Society for News Design; First place, News Series, National Headliner Award
In collaboration with designers Carson TerBush and Agnes Lee, I built a generative art opener to the story inspired by tree rings.
The visualization is customized to a reader's age, state, and gender, immediately signalling the interactive and personalized nature of the story.
Rather than a cold, clean chart, a more artistic approach to visualizing the data worked as a way to emphasize the very personal impacts these statistics represent.

The generative rings were built with the Javascript Canvas API, synced with React states to match the user inputs and scroll position.
After a lot of experimentation with Canvas animation the most performant option was the simplest: a vanilla JS implementation, using the the Canvas API and requestAnimationFrame to handle the animations between React states.


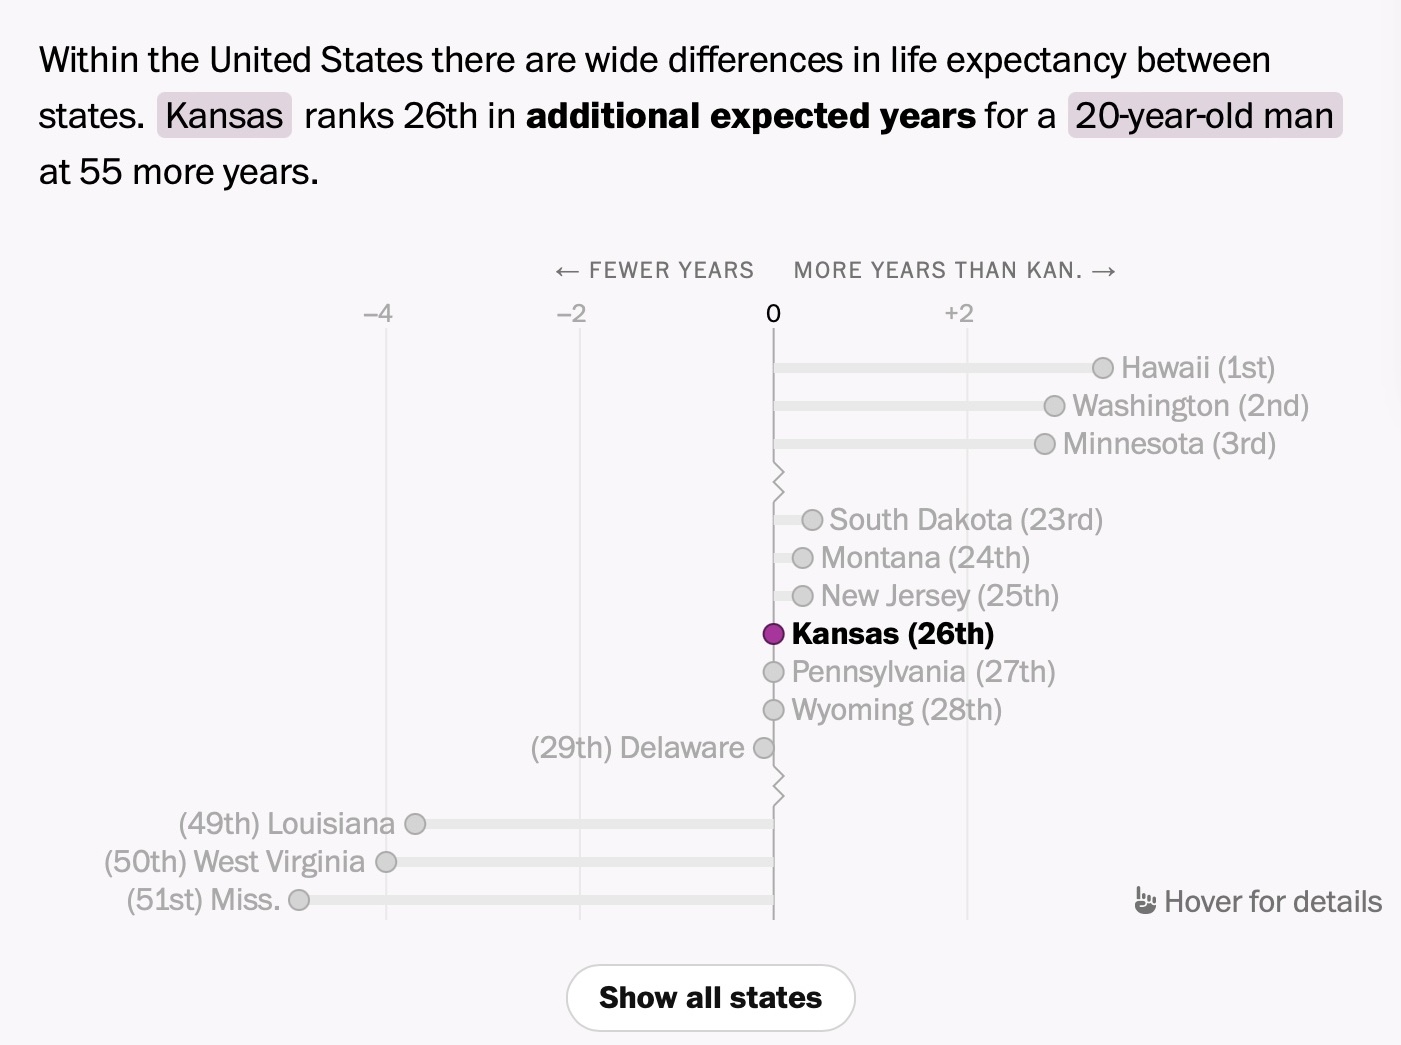
Charts, built with D3.js, were also synced with the user’s selected age, sex and state to show their personalized life expectancy compared to similar people other countries and states.